Introducing Pine BI Lite
- PINEXL
- Feb 26
- 2 min read

A Free Way to Create Better Dashboards in Excel and PowerPoint

We’re excited to introduce Pine BI Lite - a free-forever version of Pine BI, designed to help anyone create cleaner, more modern visualizations and dashboards in Excel and PowerPoint with zero friction.
For years, Pine BI has helped analysts, teams, and creators build professional-grade dashboards without wasting time on complex formulas or manual formatting. Pine BI Lite brings a curated selection of that experience to everyone - no credit card, no trial period, no limitations on use.
Just download, install, and start building.
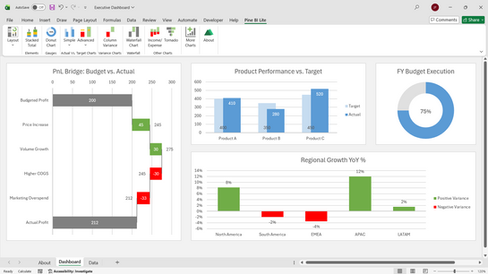
What’s Inside Pine BI Lite
Pine BI Lite includes 12 essential visuals and tools from the full Pine BI library of 50+ features. These are some of the most widely used visuals across reporting, finance, operations, and executive dashboards - now available for free.
With Pine BI Lite, you can:
Build advanced waterfall charts (including vertical) with dynamic colors, rolling totals, change value labels, and connector lines
Create donut gauge charts for quick KPI overviews
Show variance clearly with horizontal and vertical variance charts
Visualize income vs. expense with clean, intuitive layouts
Use tornado charts for comparisons and sensitivity analysis
Add stack totals to stacked column charts for clearer summaries
These visuals are designed to reduce clutter, improve readability, and help you communicate insights faster, all while staying fully native to Excel and PowerPoint.
4 Free Dashboard Templates Included
To help you get started quickly, Pine BI Lite also comes with four free dashboard templates, ready to use and fully editable.
Each template is built using Pine BI visuals and follows clean, modern design principles. Whether you’re building a financial summary, KPI overview, operational dashboard, or executive report, these templates give you a strong starting point.


Why We Built Pine BI Lite
Our goal with Pine BI Lite is simple:
Make it easier for anyone to create professional dashboards in Excel and PowerPoint - without friction or commitment.
We know that not everyone wants to jump straight into a full suite of 50+ visuals. Pine BI Lite gives you a practical, hands-on way to explore the Pine BI design system inside your own workflow, using your own data.
If you find that Pine BI Lite helps you work faster, communicate more clearly, or simply enjoy reporting more, then you’ll know exactly what the full version can unlock.
Try Pine BI Lite Today
You can learn more and download Pine BI Lite on the official page here:
We’re incredibly grateful to the Pinexl community for shaping Pine BI from the very beginning. Your feedback has guided every update, every visual, and every design decision, and we’re excited to hear what you think of Pine BI Lite.
Here’s to cleaner dashboards, faster reporting, and a smoother workflow!
Best Regards,
The Pinexl Team


Comments