Pine BI Update Version 1.1 – Introducing the Chart Editor
- PINEXL
- Jun 8, 2020
- 1 min read

We have just launched version 1.1 of Pine BI – the Ultimate Excel add-in for Charts and Dashboards.
This update adds a data label for the target in Speedometer V2 and optimizes several icons.
The biggest change however comes with the addition of the Chart Editor.
The Chart Editor allows users to format one or multiple charts at the same time. Its features save a ton of time when building the layout of a dashboard. It works not only with Pine BI charts, but with all graphs already available in Excel - even with Pivot Charts!
The Chart Editor is built on VBA and standard Excel features, just like the rest of Pine BI. This guarantees that all charts, edited by it will remain viewable and changeable by all users.
Below is a quick list of the main features:
Split a complicated graph with many data series into several single series charts.
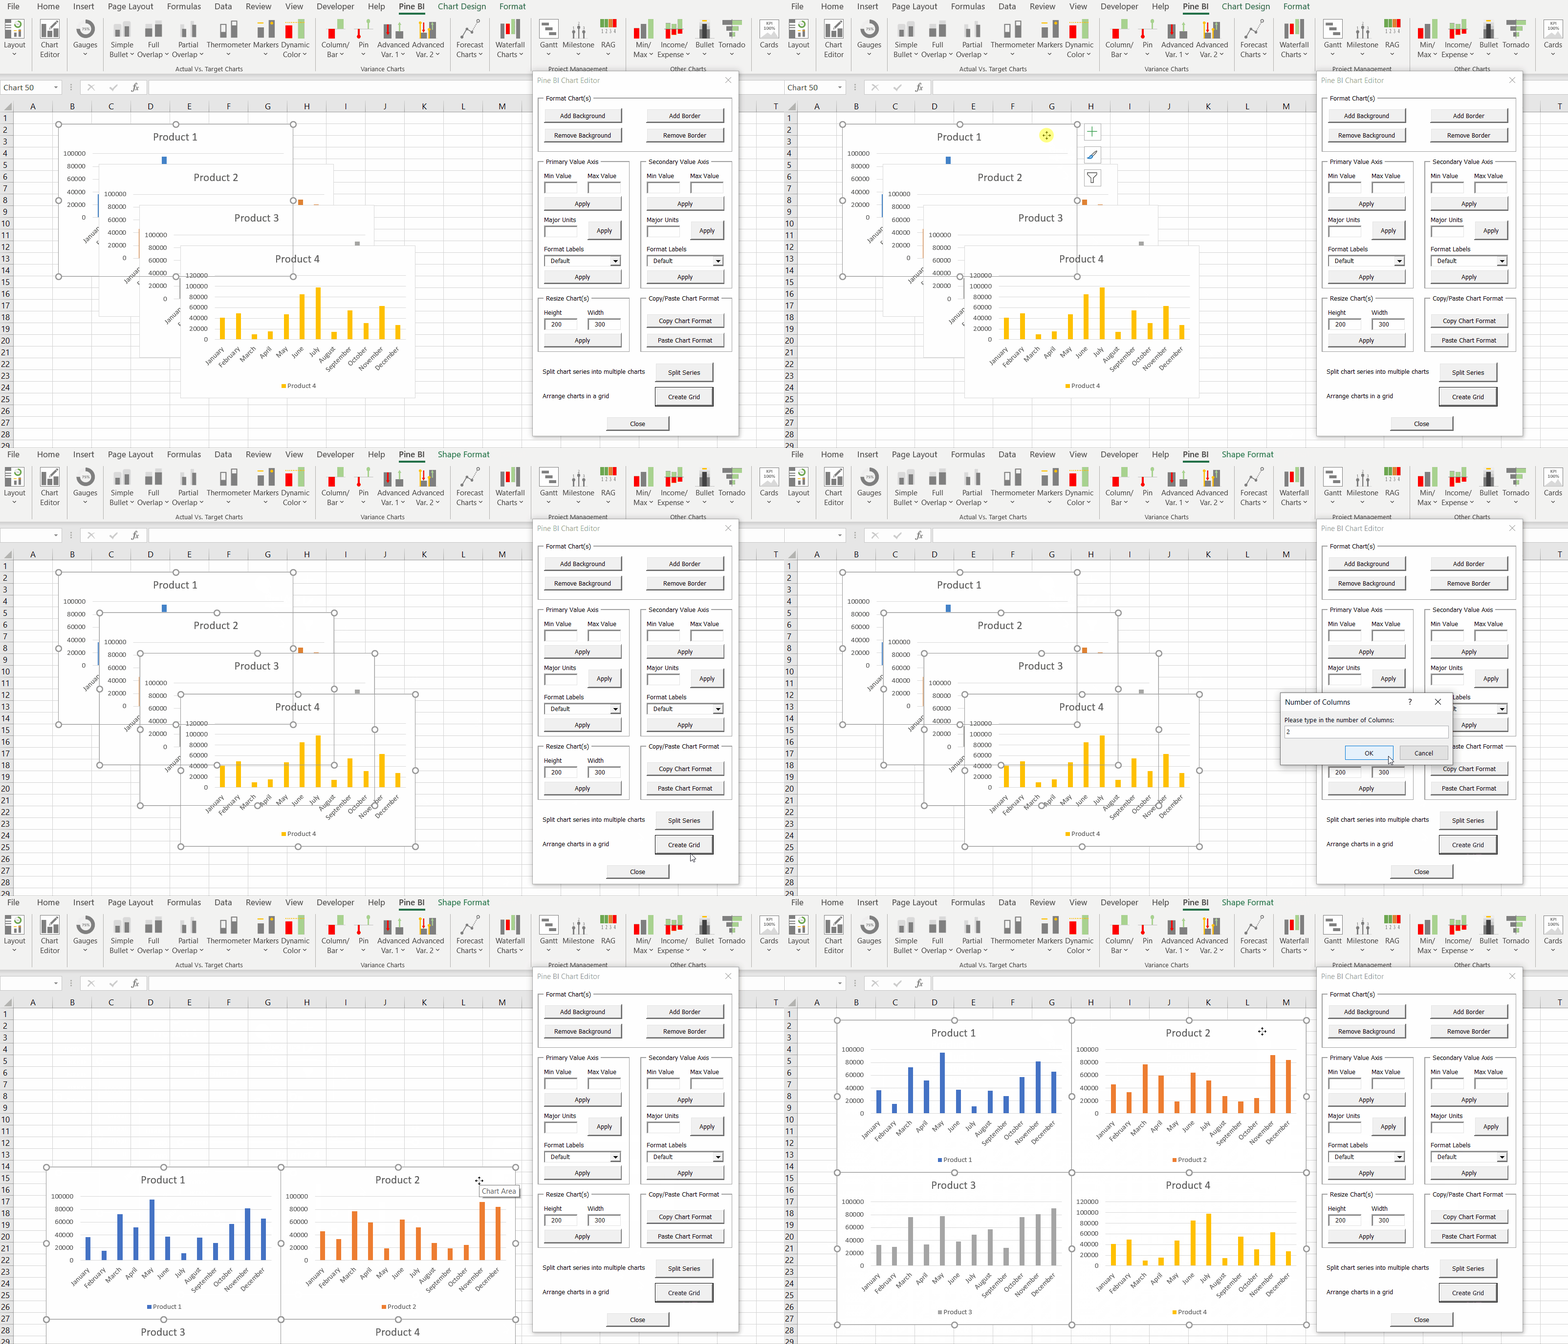
Arrange multiple charts in a grid and even chose how many columns should the grid have.
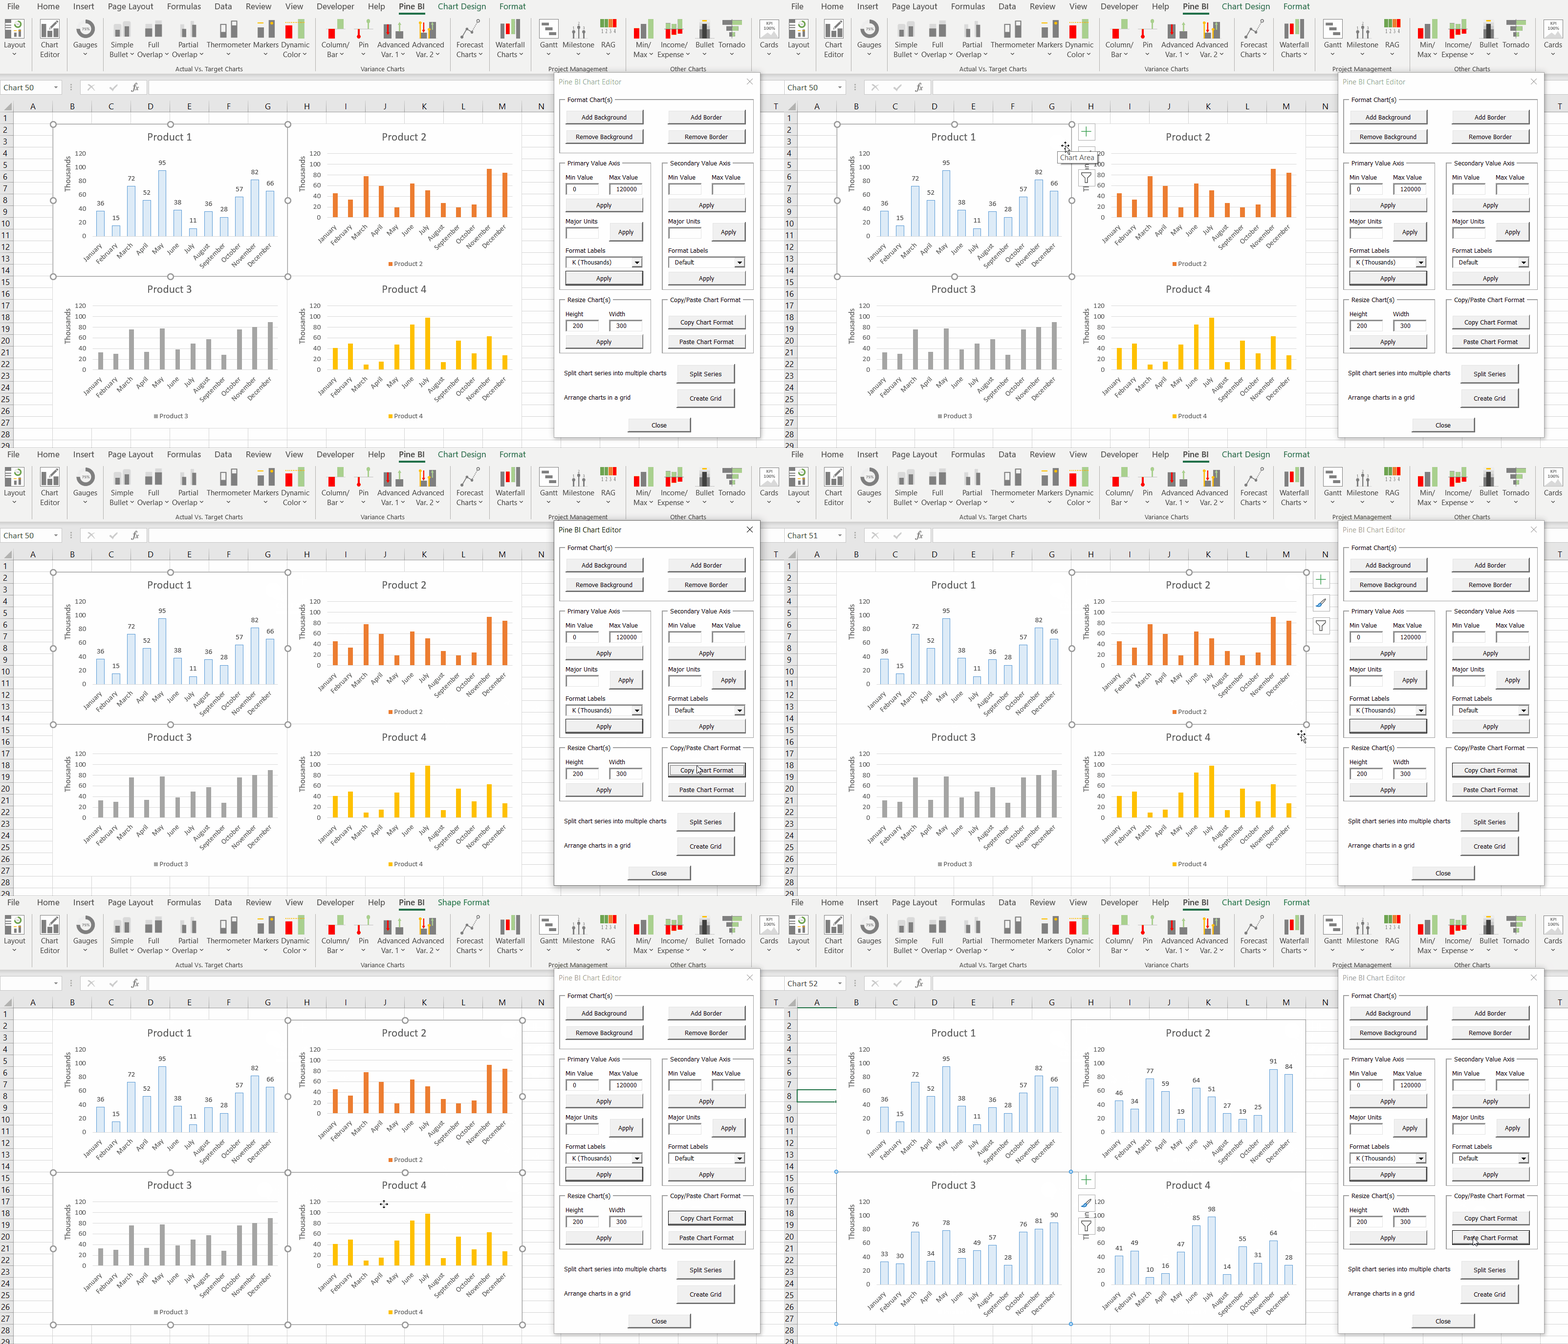
Copy a chart format and paste it to multiple charts at once, thus saving an incredible amount of time!
Edit the primary and secondary axis of charts – the min/max values, major units and it can even format the labels into thousands, millions and billions.
add/remove chart borders and backgrounds in a single click.
The amazing features of the Chart Editor are a great addition to Pine BI and make it an even more powerful tool.
Make sure to check out the features in more detail on the following Chart Editor Details Page.
Below you can find some demos of the main Chart Editor features:
Best Regards,
The Pinexl Team


Comments