Pine BI - Chart Editor


The Pine BI Chart Editor is a powerful tool, which allows users to edit one or multiple charts at the same time.
Some of the functions it provides are not available by standard Excel functionalities, thus making it a valuable tool when editing charts and creating Excel Dashboards.
Format Chart(s)
Add and remove Background color and Borders of one or multiple charts in a single click. Available for both normal and Pivot charts.
Resize Chart(s)
Resize one or multiple charts at the same time.

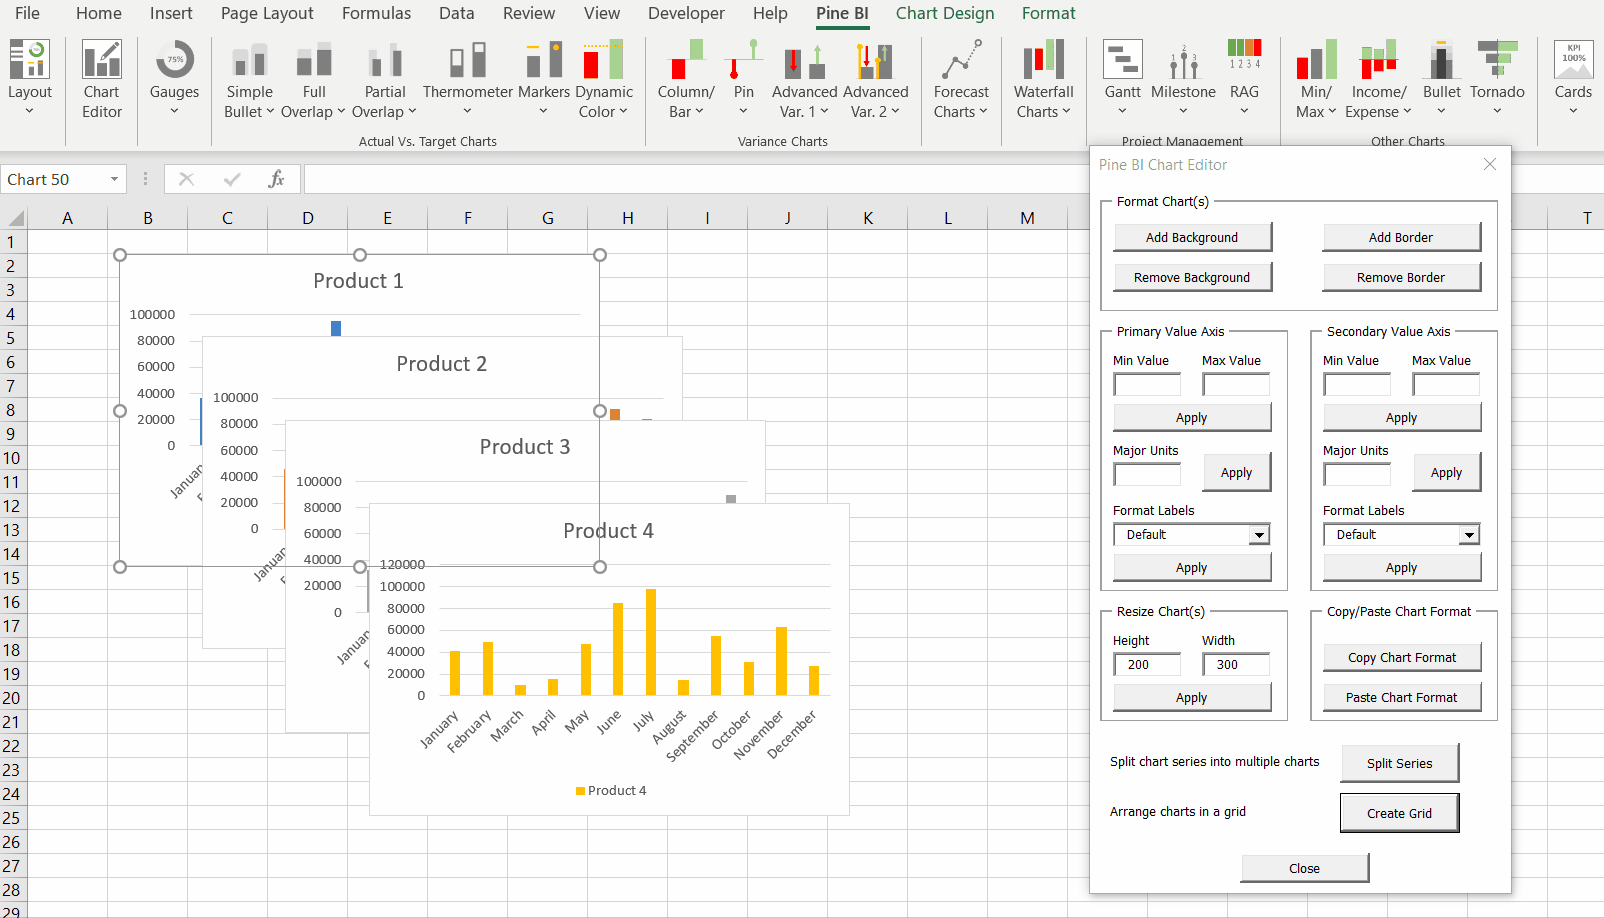
Split chart series into multiple charts
Split a complicated chart with many data series into multiple graphs with single series. All in a click of a button.
Click on the image to enlarge.
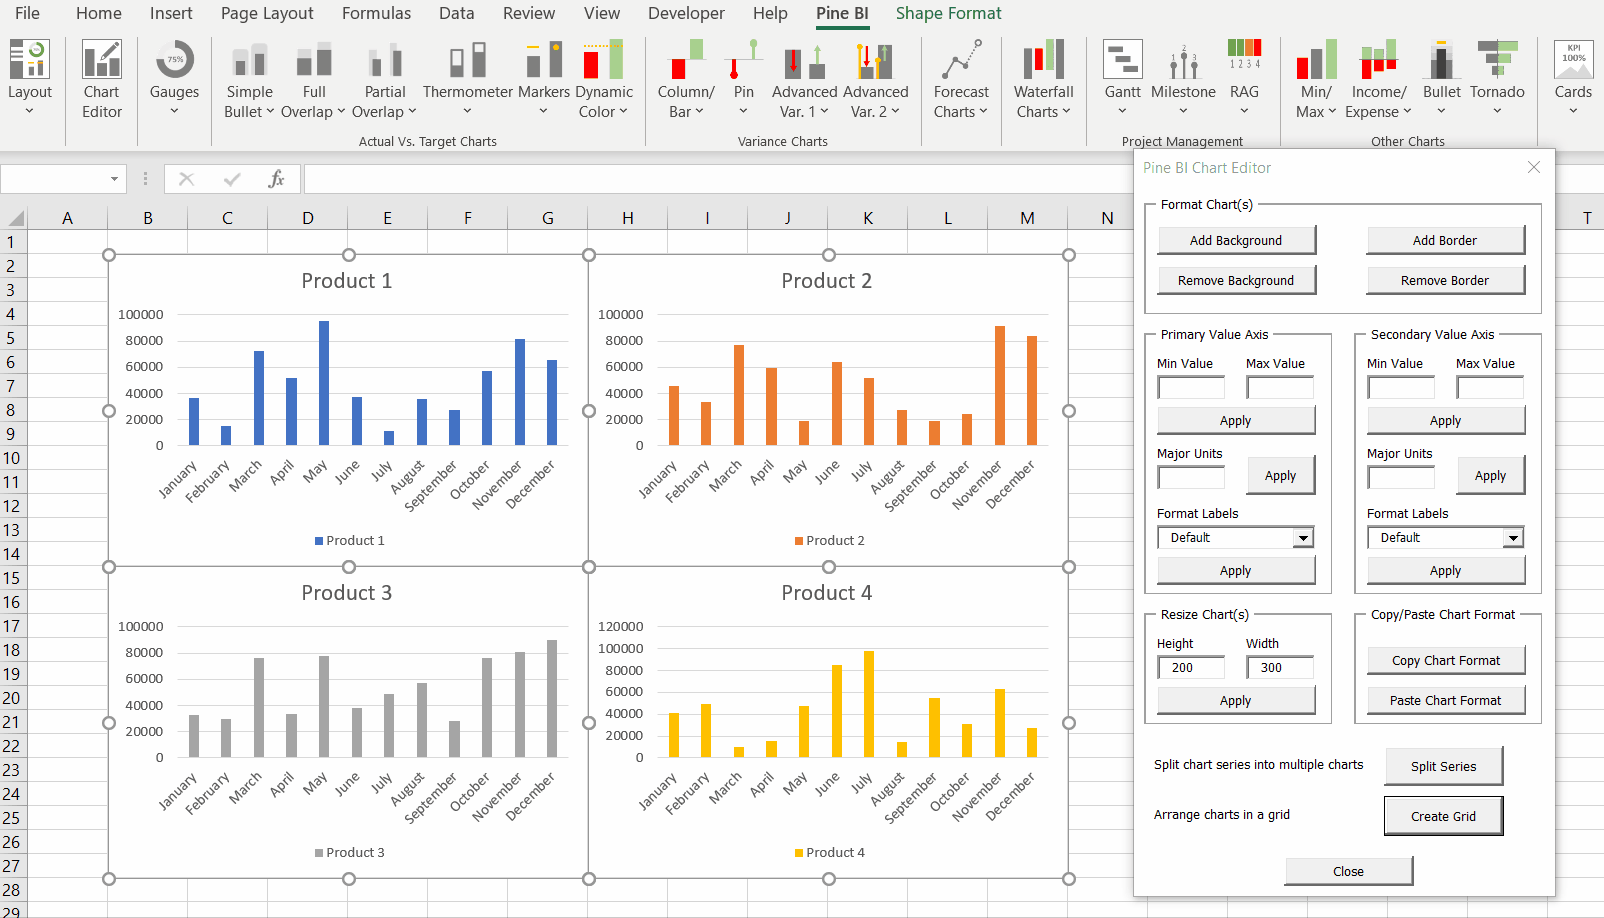
Arrange charts in a grid
Arrange multiple charts in a grid in a seconds.
You can choose in how many columns the charts will be arranged.
All charts will be automatically resized to match the size of the last selected chart.
Click on the image to enlarge.

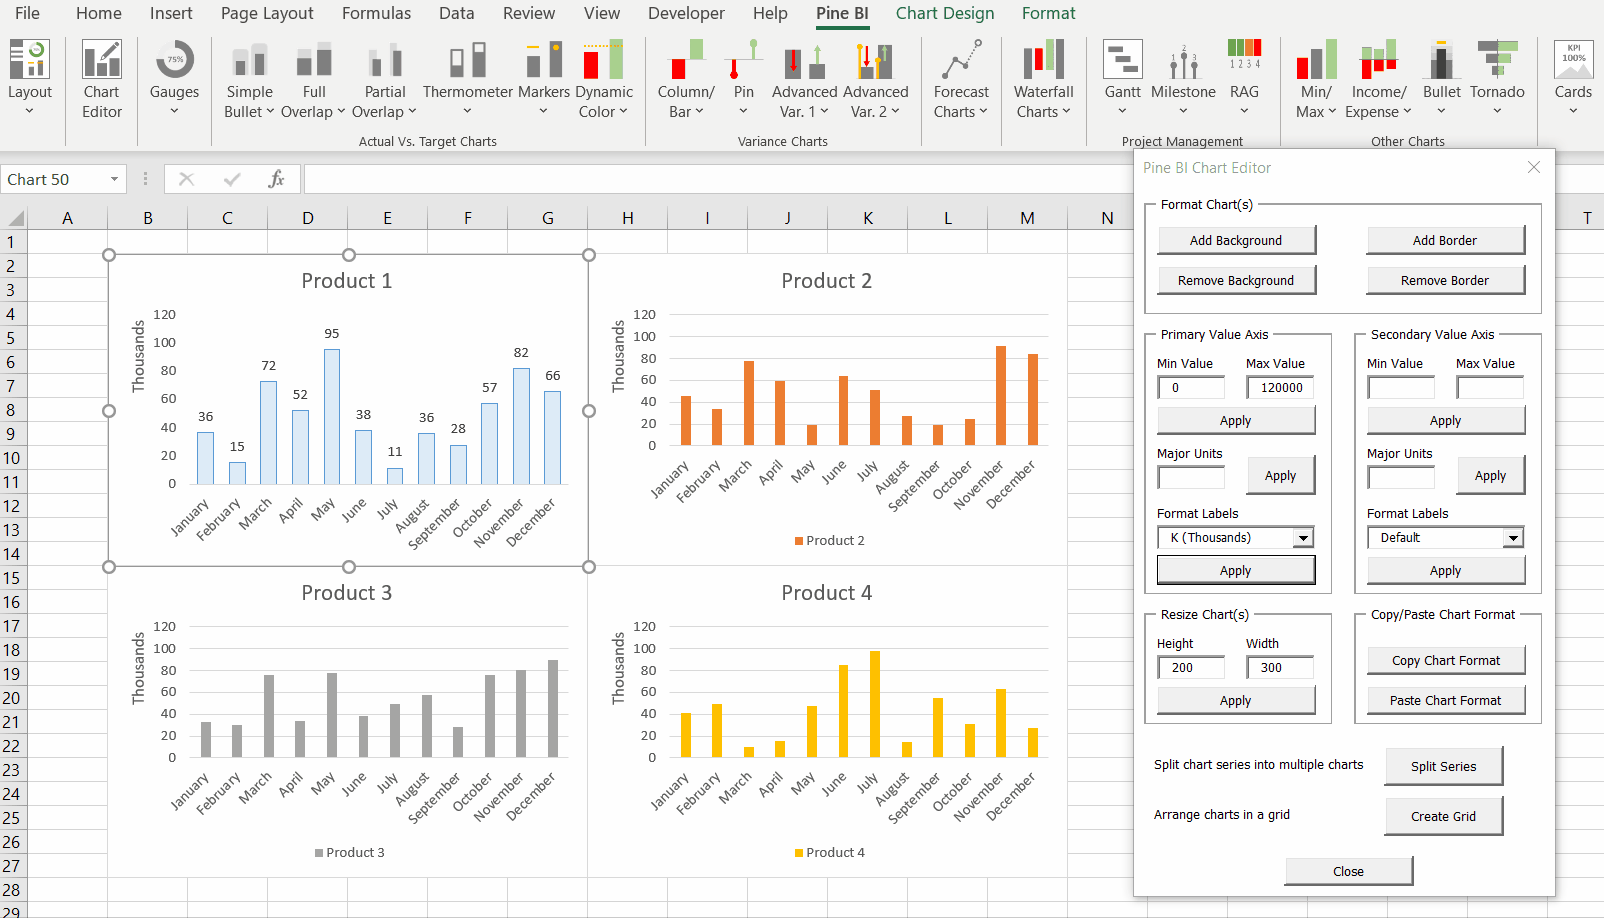
Edit the Value Axis
Set minimum and maximum axis values.
Set the axis major units values.
Change the labels amounts to thousands, millions or billions.
All of these functions are available for both the primary and the secondary axis.
They can be applied at the same time to one or multiple charts and are available for both normal and pivot charts.
Click on the image to enlarge.
Copy/Paste Chart Format
A revolutionary feature, which allows the user to copy the format of a chart and paste it to one or multiple charts at the same time.
Click on the image to enlarge.